The market is always changing, so it’s fascinating to track the changes and find ways to communicate those changes to clients and the public. I pay incredibly close attention to the value is moving, so please reach out whenever you have questions. Here are a few things to keep in mind.
1) Specific Neighborhoods: If you are curious about trends in a specific neighborhood, and I have some recent graphs, just send an email. I’m happy to share recent trends if I have them (it depends on where I am working right now of course). Otherwise I’m available for hire to run some graphs for you if it’s helpful. I do tend to post some neighborhood graphs on Twitter in case that’s relevant for you.
2) Big Market Update: Once a month I do a big monthly market update. You can find that post by clicking on the market trends category. It comes out between the second and third week of the month and contains anywhere from 50-75+ graphs to help visually show what the market is doing. There is one paragraph to describe the market and quick talking points to hone in on specific trends. This post is not so much about individual neighborhoods, but county and regional trends.
3) Each Appraisal: Seeing the market visually is profoundly helpful. That’s why all my appraisals have multiple neighborhood-specific trend graphs to help show what the market has been doing. Sometimes it’s only a few graphs, while other times it might be 15-20 graphs. It depends on the complexity of the appraisal and the reason for the appraisal.
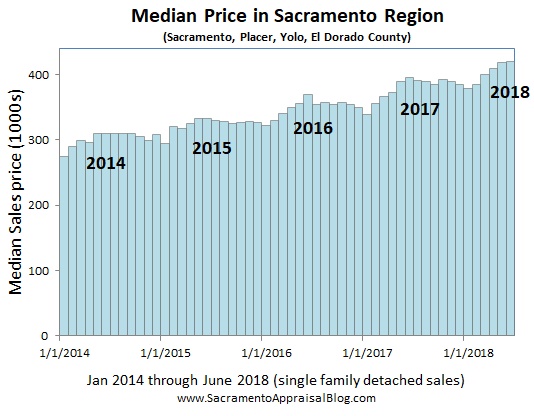
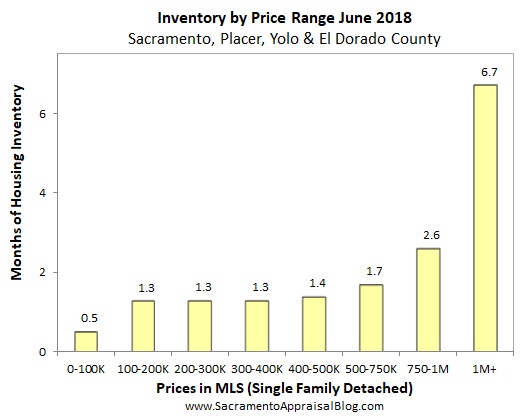
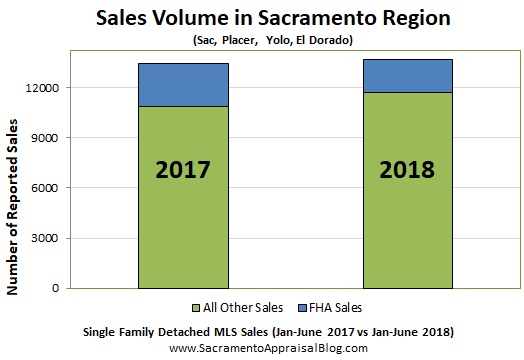
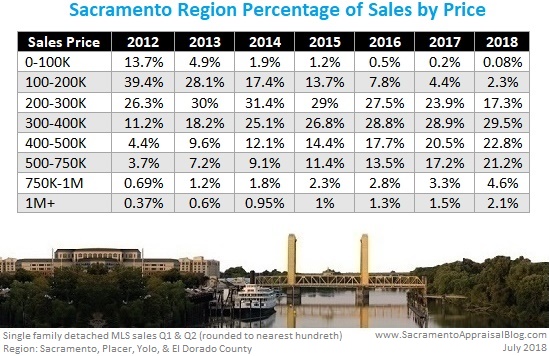
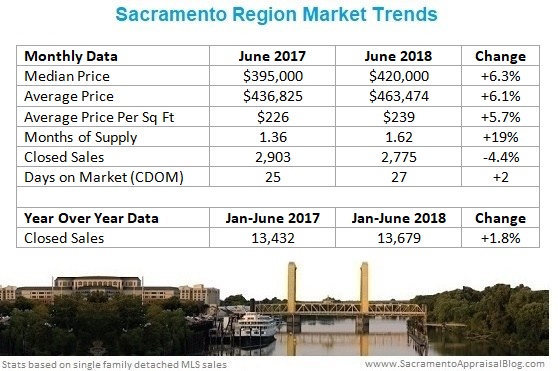
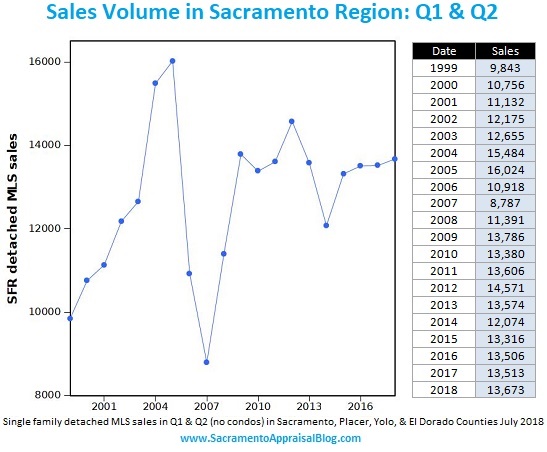
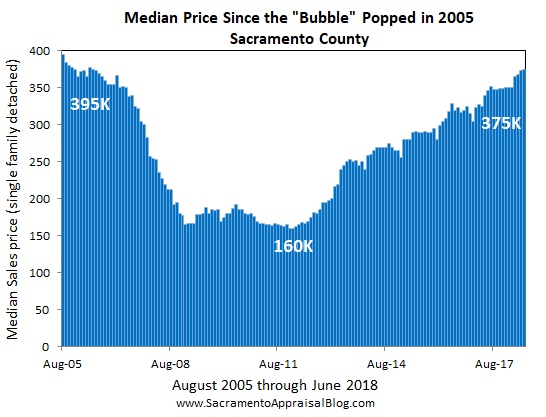
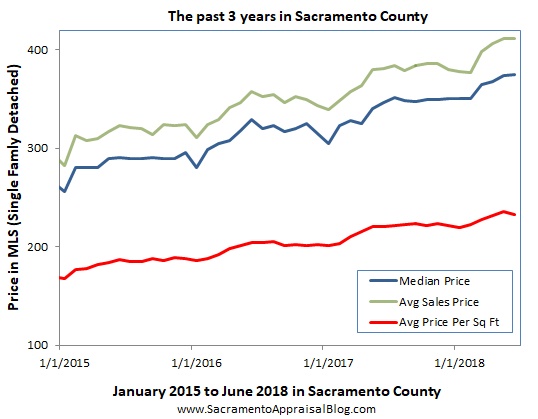
Have a look at several example graphs below to get an idea of what we are talking about, and contact us with any questions at 916-595-3735 or email us at LundquistCompany@gmail.com.
If you need customized research, please reach out.
